Evaluation of Cenospheres in Fly Ash
Introduction
Microbeam Technologies, Inc. (MTI) has developed a predictive tool to assess cenosphere formation in different coal fly ash size fractions. This tool is based on the mineral composition, type, and abundance in the coal feedstock and the temperature profile within the boiler, providing a valuable tool for identifying coal feedstocks with high potential for cenosphere formation.
Background
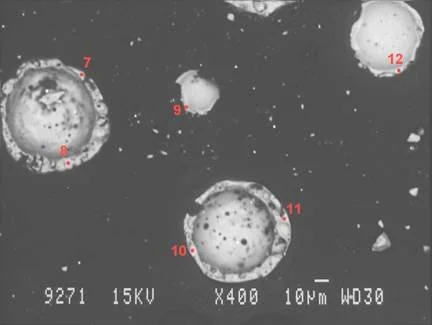
Cenospheres are low-density microspheres produced from coal fly ash (Figure 1). Cenospheres are typically 20-300 microns in diameter, are rich in aluminosilicates, and have a specific gravity of <1.0 g/cm3. The formation of cenospheres is governed by the amount and rate of evolution of the blowing agent, slag viscosity and surface tension, and amount of slag material present.
Cenospheres have applications in a wide range of industries, including:
Oil and gas
Paints and coatings
Plastics and polymers
Construction
Syntactic foams
Biomedical/pharmaceuticals
Available resources are insufficient to meet current demand for cenospheres, therefore, recovering cenospheres from fly ash after coal combustion is economically advantageous.
Figure 1. Coal fly ash containing cenospheres (SEM image of fly ash cross section).
Case Study: Predicting Cenosphere Formation for Different Coal Feedstocks
MTI collaborated with the University of North Dakota to develop a tool to predict the formation of cenospheres in fly ash during coal combustion. The model uses the temperature profile within the client’s specific boiler and mineral distribution data to predict cenosphere formation, then determines the final weight percent of cenospheres in each fly ash size fraction (Table 1).
Table 1. Cenospheres (wt. %) predicted to form in each fly ash size fraction for 3 coal feedstocks.
Key Findings:
No cenospheres were predicted to form in the submicron fraction.
Coal #2 was predicted to form the most cenospheres, likely due to increased kaolinite and montmorillonite mineral types in the coal.
Mineral particles with appropriate base-to-acid ratios and lower silicon content were more likely to form cenospheres.
Morphological analysis revealed that the cenospheres were primarily composed of silicon (Si) and aluminum (Al), with smaller amounts of sodium (Na), iron (Fe), and magnesium (Mg).
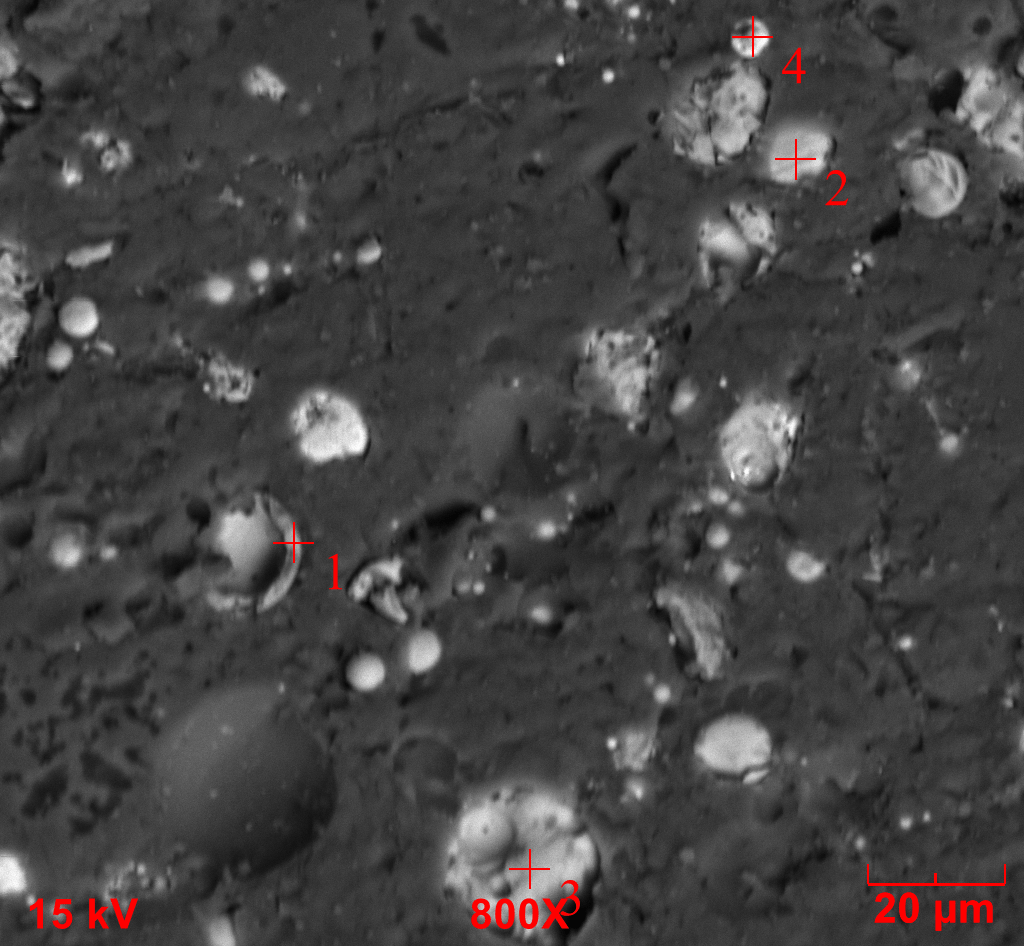
To validate the tool's predictions, MTI utilized image analysis and particle counting techniques, specifically through scanning electron microscopy (SEM). The observed trends in the SEM images aligned closely with the model’s predictions. Figure 2 shows an example image used in the validation process, where particles 1, 3, and 4 were confirmed to be cenospheres based on MTI's criteria:
Spherical particle
Diameter between 2 and 100 µm
Presence of aluminum and silicon
A visible bubble or hole in the structure
Figure 2. Backscattered electron image of coal fly ash showing points 1-4.
Summary
MTI’s cenosphere modeling predictions provide valuable insight into the relative ability of different coal feedstocks to form cenospheres in the fly ash. By leveraging this tool, clients will be able to optimize their choice of fuels for their desired application.


