SEM Morphological Analysis
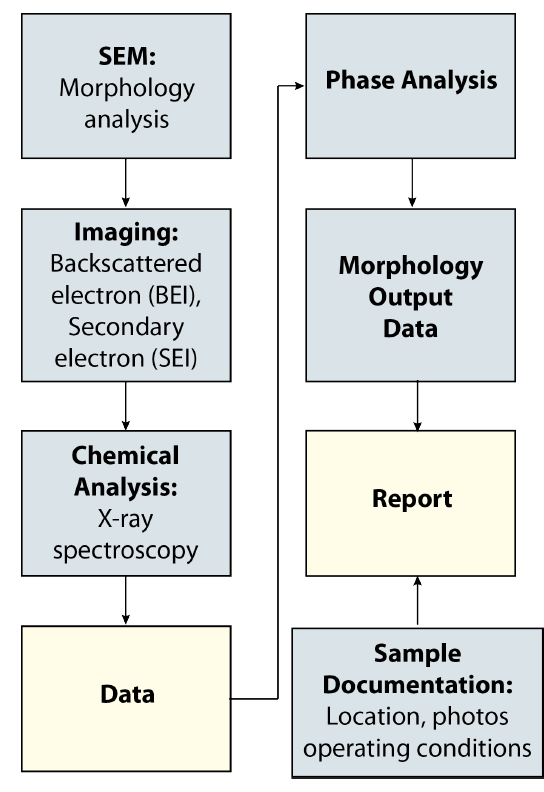
In addition to automated scanning electron microscopy techniques, MTI uses morphological analysis to fully characterize materials. While automated SEM analysis provides quantified information about chemistry, size, and number of phases and particles present, morphological analysis provides information about the physical relationships of the size, crystallinity, and juxtaposition of the phases present.
For example, a morphological investigation of deposits provides insight about the characteristics of the liquid phases responsible for growth of necks (particle-to-particle bonding) between deposited particles and the formation of a sticky-deposit surface capable of capturing impacting particles.
Compare with
Scanning Electron Microscopy Point Count (SEMPC), which to characterizes entrained ash and deposits. Often by combining SEMPC with morphological analysis, MTI can provide a good understanding of a particular deposition problem.
or Computer-Controlled Scanning Electron Microscopy (CCSEM), which is used to determine the size, composition, abundance, and association of mineral grains in prepared coal, biomass, and petroleum-coke samples. Utilizing this method allows us to assess the behavior of the mineral grains during combustion or gasification.
Morphological SEM Imaging
To determine the cause of an ash-deposition problem, Microbeam uses morphological analysis and scanning electron microscopy point count (SEMPC) analysis. These analysis methods provide information on the degree of melting and interaction of the various deposited ash particles. SEMPC supplies a quantitative determination of the abundance of phases present in the ash. By examining the phases present, the material responsible for the formation of the deposit is identified.
Morphological analysis supplements SEMPC analysis well because it provides information about the physical relationships of the microscopic components of the deposit. Morphological analysis reveals the size, crystallinity, and juxtaposition of the phases present.
The backscattered electron images below are examples of a cross-sectioned deposit sample collected from a boiler wall. Cross-sectional analysis of such samples allows for the orientation and structure of the original sample to be maintained while also permitting characterization of key aspects of the sample. In this case, the deposit surface and key layers within the deposit can be viewed and characterization. This information can be key to determining the conditions under which the deposit formed.
Left: Backscattered electron image (BEI) of a cross-sectioned deposit collected on a boiler wall. Right: The same image annotated with SEM selected points (1-11) for morphological analysis.
Both images were taken at 150x magnification using Microbeam’s JEOL JSM 840 scanning electron microscope with elemental composition of the selected point determined using IXRF software.
Deposit Morphology Table
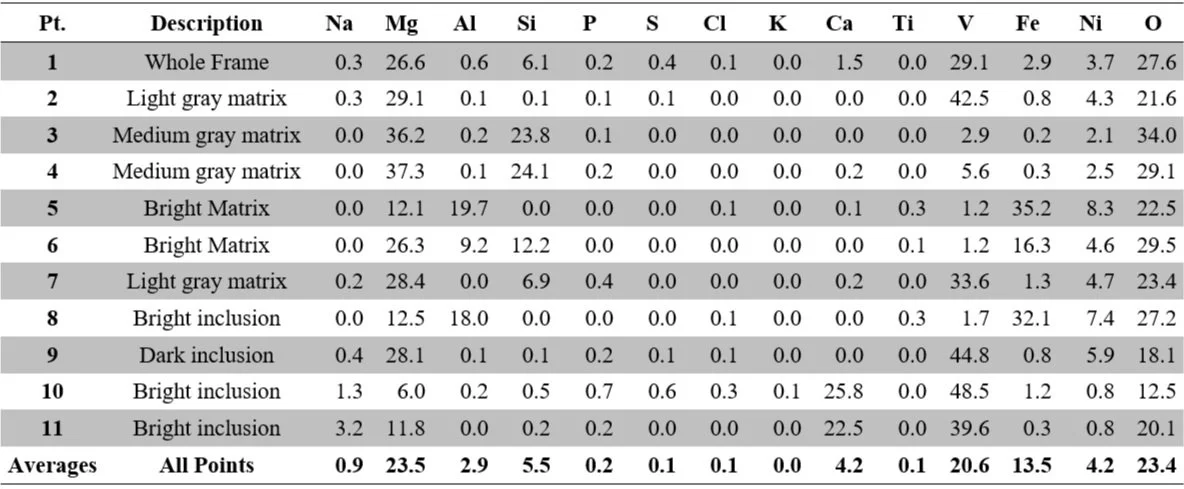
The morphological table below summarizes the elemental composition as determined by IXRF.
The points correspond with the right annotated BEI image above with the 11 selected points. The first point corresponds to an overall area scan within the square selection bounds or the “whole frame” of the image.
Point descriptions are qualitative and designated by microscope operators. Terms used may include words like matrix, bonding phase, particle, particle surface, particle edge, or any number of custom descriptions unique to the sample.
Morphology Method
Let’s work together
Interested in learning more? Contact us to see how we can help.


